Charging and Cost Savings Reports
What’s it For?
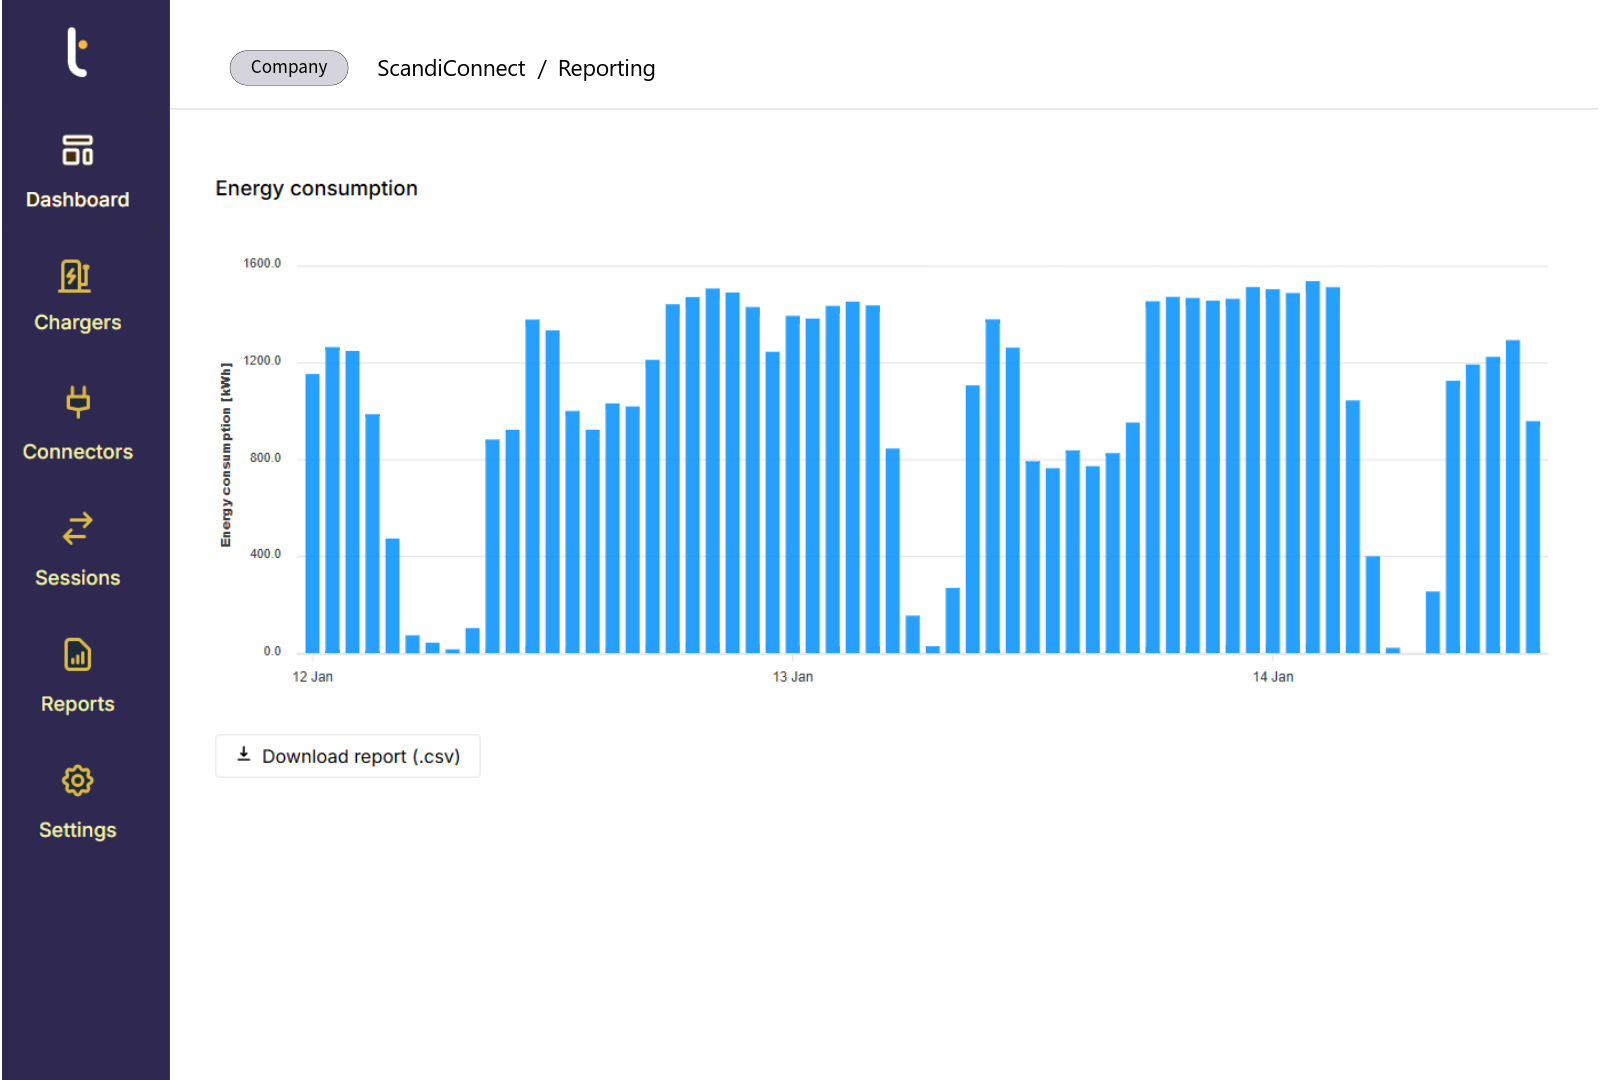
Charging and cost savings reports show what it costs to charge your fleet and how much managed charging saves. Tenix Charge records every charging session with its energy, time, charger and price, and turns that data into reports by bus, route and depot. Finance, operations and depot teams work from the same numbers, and you can show the return on charge management in figures.

Why Charging Data Matters
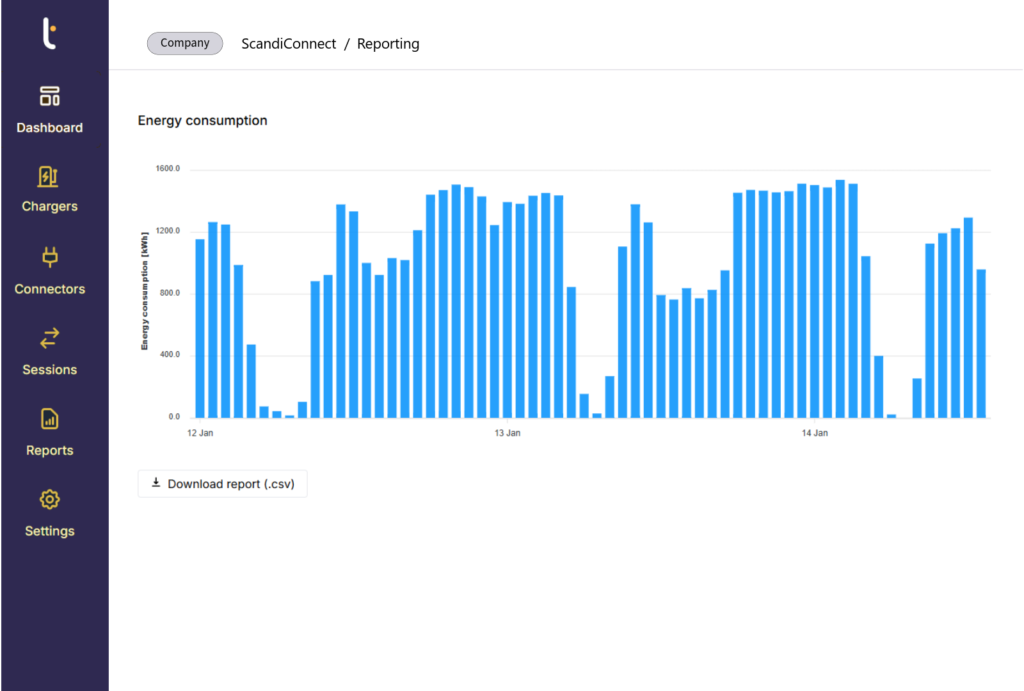
Energy is one of the largest running costs in an electric fleet, and it is hard to see where it goes. Electricity bills arrive per site and per month, charger data sits in separate portals, and a single hour of high demand can set the peak charge for the whole month. Without session-level data, it is difficult to tell which buses, routes or depots drive cost, or to show what a change in charging strategy has delivered.
What Charging and Cost Savings Reports Provide
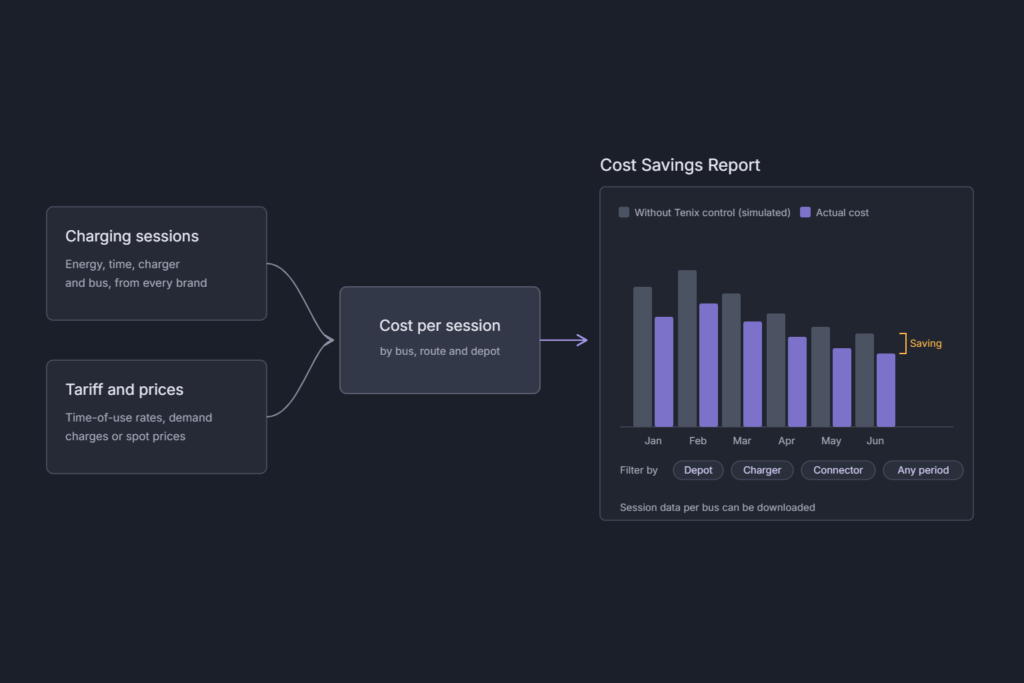
Each charging session gets a cost, calculated from your electricity tariff, including time-of-use rates and demand charges. Reports show energy use, charging transactions, charger uptime and cost per bus, route and depot, in real time and over any period. The cost savings report compares your actual charging cost with a simulation of the same sessions without Tenix control, so you can see what peak shaving, price-based planning and charging to the right SoC have saved.
How Charging and Cost Savings Reports Work
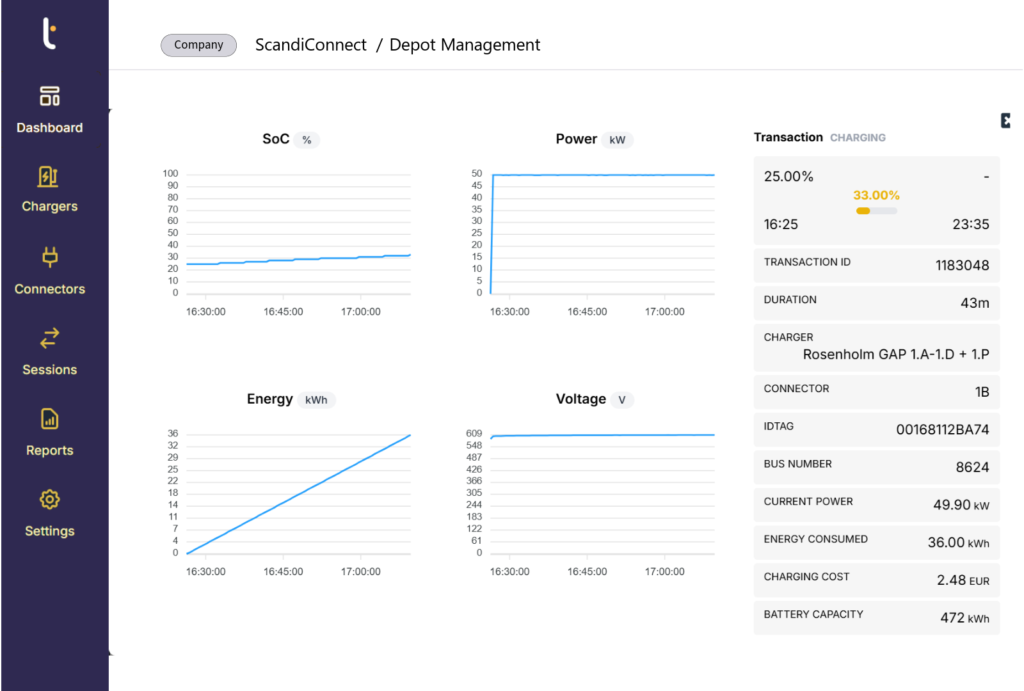
Tenix Charge logs every session from every charger, whatever the brand, with energy drawn, start and end time, charger, connector and vehicle. It applies your tariff, or hourly spot prices such as Nord Pool day-ahead prices, to calculate the cost of each session. Reports can be configured by depot, bus type and cost, and session data per bus can be downloaded for your own analysis or finance systems. The same data feeds environmental reporting for your ESG KPIs.
Key Capabilities
Charging and cost savings reports turn every charging session into clear figures on energy, cost and savings.
Cost per session
Calculate the cost of every session from your tariff or hourly energy prices.
Cost savings report
Compare your actual charging cost with a simulated baseline without Tenix control.
Configurable reports
Break down energy use, transactions, uptime and cost by depot, bus type, route and bus.
Downloadable session data
Export session data per bus for your own analysis, invoicing or finance systems.
Frequently Asked Questions
Got a different question? Just contact us and ask.
How is the saving calculated?
Tenix Charge compares your actual charging cost with a simulation of the same sessions without Tenix control, using your tariff or hourly energy prices. You can view the saving for a depot, or down to a single charger or connector, over a day, week, month or any custom period.
Can the reports include demand charges?
Yes. Enter your electricity tariff with its time-of-use rates and demand charges, and every session and report uses it.
Can we export the data?
Yes. Session data per bus can be downloaded, so finance and operations teams can use it in their own tools.
Can we report across several depots?
Yes. Reports can be filtered by depot, bus type and cost, and compared across all your depots in one place.
Explore
Resources for Improving Charge Operations

READY TO GET STARTED?
Join hundreds of satisfied operators using Tenix
To start the conversation, contact us.
Book a demo